Physical Address
304 North Cardinal St.
Dorchester Center, MA 02124
Physical Address
304 North Cardinal St.
Dorchester Center, MA 02124

Today, let’s know about Google Analytics. At that instant, a question is arises in your mind “What is Google Analytics?”.
Google Analytics is a free web analytics tool offered by Google. Which tracks and reports your website traffic in the form of a pie chart and graph.
Before starting Google Analytics, you should know the terms used in Google Analytics for better understanding.
- Audience– It reports information about your visitors in the segmented form of Interest, Geo, Technology, Mobile, etc.
- Acquisition– It shows where visitors land on your page or website. It can be from the search engine, Adwords, Social media, or from your campaigns.
- Behavior– It shows the behaviors of your website like site speed, site content, site flow, and site events.
- Bounce Rate– Bounce rate is the percentage of single-page visits. It means the percentage of users who leave your website without opening another page.
- Campaigns– Campaigns allow you to add custom campaign parameters to any URLs from your website to get more information on your referral traffic. See which campaign sends traffic to your website.
- Conversions– Conversion contains data about how many times your goal is completed.
- Goals– Goals are the way to measure how well your targeted actions are completed. You can set up individual goals for discrete actions like Thank you for registering! page, download complete screen, etc.
- New Sessions– It shows the estimated percentage of first-time engaged users (New users).
- Pageviews– It shows how many times your pages are viewed in a selected time period.
- Pages/Session– This is the average number of page views per session.
- Sessions– It shows the number of engaged users of all returning users and new users.
- Users– Who have at least one time engaged to your website.
Google Analytics (www.analytics.google.com) is a free tool to track information about your users. How they perform on your website. That can be either an E-commerce website or can be a Blog. It doesn’t matter what type of website you run, all you need the information about your customer’s journey. As a business owner or a marketer, having information about your customers must be helpful. It allows you to make an informed decision that is very helpful to grow your business that does Google Analytics. Google Analytics tracks and reports all journeys of your customers on your website.
When you log in with your Google account in Analytics. You land on the Home page containing a list of all of the websites that you have set in your account. The list shows some basic data like Sessions, Avg. sessions, Bounce Rate, and Goal conversion rate.
You can set the time range for a particular time period. You can also search for a particular website in the search bar if you have a lot of websites on your list.
After that, If you want to see more data about a specific website click on the corresponding website. Then you see a Reporting page consisting of all data about your Audience. You can see Sessions, Users, Pageviews, Pages/Sessions and etc. You can also see the percentage of New visitors and Returning visitors in the form of a pie chart.
On the left side of the page, you can see a Toolbar.
On which you can see the Dashboard, Shortcuts, Intelligence Events, Real-Time, Audience, Acquisition, Behavior, and Conversions.
On the Dashboards, you can see graphs of New users, Users, Sessions, Sessions by Browser, Bounce rate, Revenue, and Goal completion.
In Shortcuts, You can save your shortcuts to reach fast where you want. Like I save shortcuts for Audience overview, Devices, and Network referrals. You can save any tool into shortcuts by just clicking on the shortcut button (upper right of the tool).
In Intelligence events, you can set alerts whenever it occurs, it sends you an email. You can set alerts like the sudden change in sessions or bounce rate and etc.
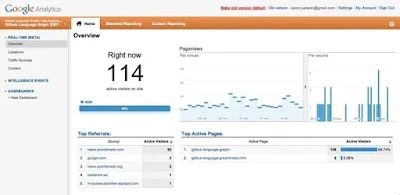
Real-time shows you how many visitors are engaged currently at that time. In other words, you can understand this, when your friends are online on Facebook, the chat room shows him/her online. In this when a visitor is online on your website this shows him/her as an active user.

In the Audience section, It gives information about visitors. His/Her location, Technology (Browser and OS) used, Which device is used, His/Her behavior like New or Returning visitors, the frequency of sessions, and much more about users. The images are shown in the reporting page section.
It shows how the visitors land on your site. It can be either from organic search, from Referral, from Social, or from Direct, and can be also from AdWords or through Campaigns.
Behavior shows the behavior of your site. How can they perform according to visitors? It shows site speed, site flow, and other properties of your site.
Conversions contain Goals. It is specially used for a sales funnel. You can see how many visitors are converted into the sale. You can see Product performance, sales performance, and also transactions.